E C G Leads
You might want to read the ECG Basics entry to familiarise yourself with basic ECG physiology.
Overview
What is a “lead”? It’s really one of the recording traces on the ECG printout. Don’t confuse the actual wires connecting electrodes with “leads”. Some leads are created by connecting the electrodes together in different ways. A good cardiologist can read each different lead on an ECG to gain a deep understanding of the position and size of the heart, its rhythm, and as how the cardiac action potential is conducted around it. Getting to that advanced level is beyond the scope of this entry.
Three electrodes – connected in different ways – provide the first six leads (I, II, III, aVR, aVL and aVF) of the ECG. These provide views of the heart in the frontal plane. A further six electrodes arranged around the thorax are used to generate the remaining six leads (V1-V6). These “precordial” leads view the heart from different positions in the horizontal plane.
The limb (I-III) leads: both arms and left leg
A simple, three lead ECG records from three electrode, one placed on the left leg (AKA “foot”) and one on each arm. Each limb acts essentially as a wire connecting to a point on the torso. These three points are known as Einthoven’s Triangle, named after one of the fathers of cardiac electrophysiology. Each electrode is connected to the ECG recorder, which measures the potential difference between each pair of electrodes in millivolts (mV).

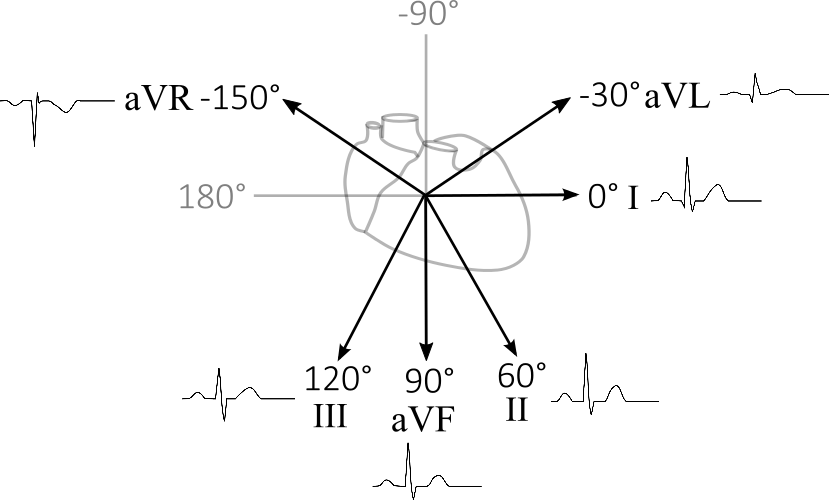
This simple arrangement of three electrodes allows for three very different electrophysiological views (or “leads”) of the heart. Recordings between the right arm (RA) and the left arm (LA) provide a horizontal view of the heart across the torso; this is lead I and is designated at an angle of 0° (Figure 2). Lead II records between RA and the left leg (LL), providing a view of the heart at 60° relative to lead I. Finally, lead III records the 120° angle between the LA and LL.

The unipolar leads: aVL, aVR and aVF
So far, we have an arrangement of electrodes providing three leads, but we can generate three more useful leads by connecting two electrodes together and recording from the remaining electrode. By connecting two electrodes together, we get the average point between them. So, for example the lead augmented Voltage Left (aVL) records activity from halfway between RA and LL, pointing towards LA, or 30° (Figure 3). Because only one electrode is a physical reality, while the others is the electrical summation of two others, these leads are known as unipolar. We can use a similar trick to make augmented Voltage Right (aVR) and augmented Voltage Feet (aVF) at -150° and 90°, respectively.

As all of these leads views the heart from a different angle, the signals they produce are slightly different representations of the cardiac dipole as it spins during excitation of the heart. If you average all of the vectors of the cardiac dipole as it moves, the result is a vector at roughly 60°, which is aligned most closely to lead II. Hence, the changes in the ECG tend to be more pronounced in this lead. For this reason, lead II is the classic, textbook representation of the ECG.
The differences between the leads are - for the most part – pretty subtle. Lead II and aVR point in roughly opposite directions, and so are vertical mirror images of each other, because they “look” at the heart from nearly opposite directions. If the cardiac dipole was just a simple vector (rather than one that changes direction and amplitude over time), and you placed electrodes perpendicular to it, there would be no signal to record at all. Because, aVL is close to perpendicular to the average cardiac dipole (which is about 60°) it usually has the lowest amplitude waveforms. It might seem odd to record a poor signal, but remember this might not be the case in a patient with cardiac pathology. A cardiologist can “read” the overall picture from all of the leads.
The six precordial leads
The leads described above provide information about the electrophysiology of the heart in the frontal plane only. The purpose of the remaining six precordial leads is to provide a similar picture but in the horizontal plane. These leads are generated from six different electrodes placed from the right edge of the sternum to the left mix-axillary line. The three bipolar leads describe above (RA, LA and LL) are all connected together to make a common electrode that reads from the average of their positions (Wilson’s central terminal) – the middle of the chest. Each precordial lead is a measurement from this common point to each of the precordial electrodes. Thus, like the augmented leads (aVL, aVR and aVF) these are unipolar leads, since they are not recorded from a single, physical lead, but the result of the electrical summation of other leads.

Putting it all together
A twelve lead ECG provides an overall picture of the passage of the cardiac dipole as its position changes during the depolarisation and repolarisation of the heart. Each lead provides an individual view, but they can be categorised into the general area of the heart which they monitor:

Different problems in different regions of the heart will show up on the ECG in different leads. An example of where this can be important is in ST-elevated myocardial infarction which can be differentiated from other causes of ST-elevation by where and how the ECG signal is abnormal.